North Africa
North Africa
The IPCC’s Sixth Assessment Report: What’s in it for North Africa?
This factsheet highlights:
- How North Africa’s climate is already changing
- North Africa’s future climate
- Climate change impacts we have already seen in North Africa
- Future climate risks in North Africa
- North Africa’s potential to adapt
- Key investment areas for a climate-resilient North Africa
Explore the factsheet, along with free-to-use images and infographics, below.

Image of harvesting olives in Tunisia
Courtesy of Citizen 59 via Flikr

Image of exposure to flooding from sea level rise in Cairo and Alexandria
Courtesy of CDKN

Image of a young farmer harvesting his wheat crop near Luxor, Egypt
Courtesy of Mina Guli via Flickr

Image of forest fire
Courtesy of Matt Palmer via Unsplash

Image of sunset over the ocean
Courtesy of matthew Feeney via Unsplash
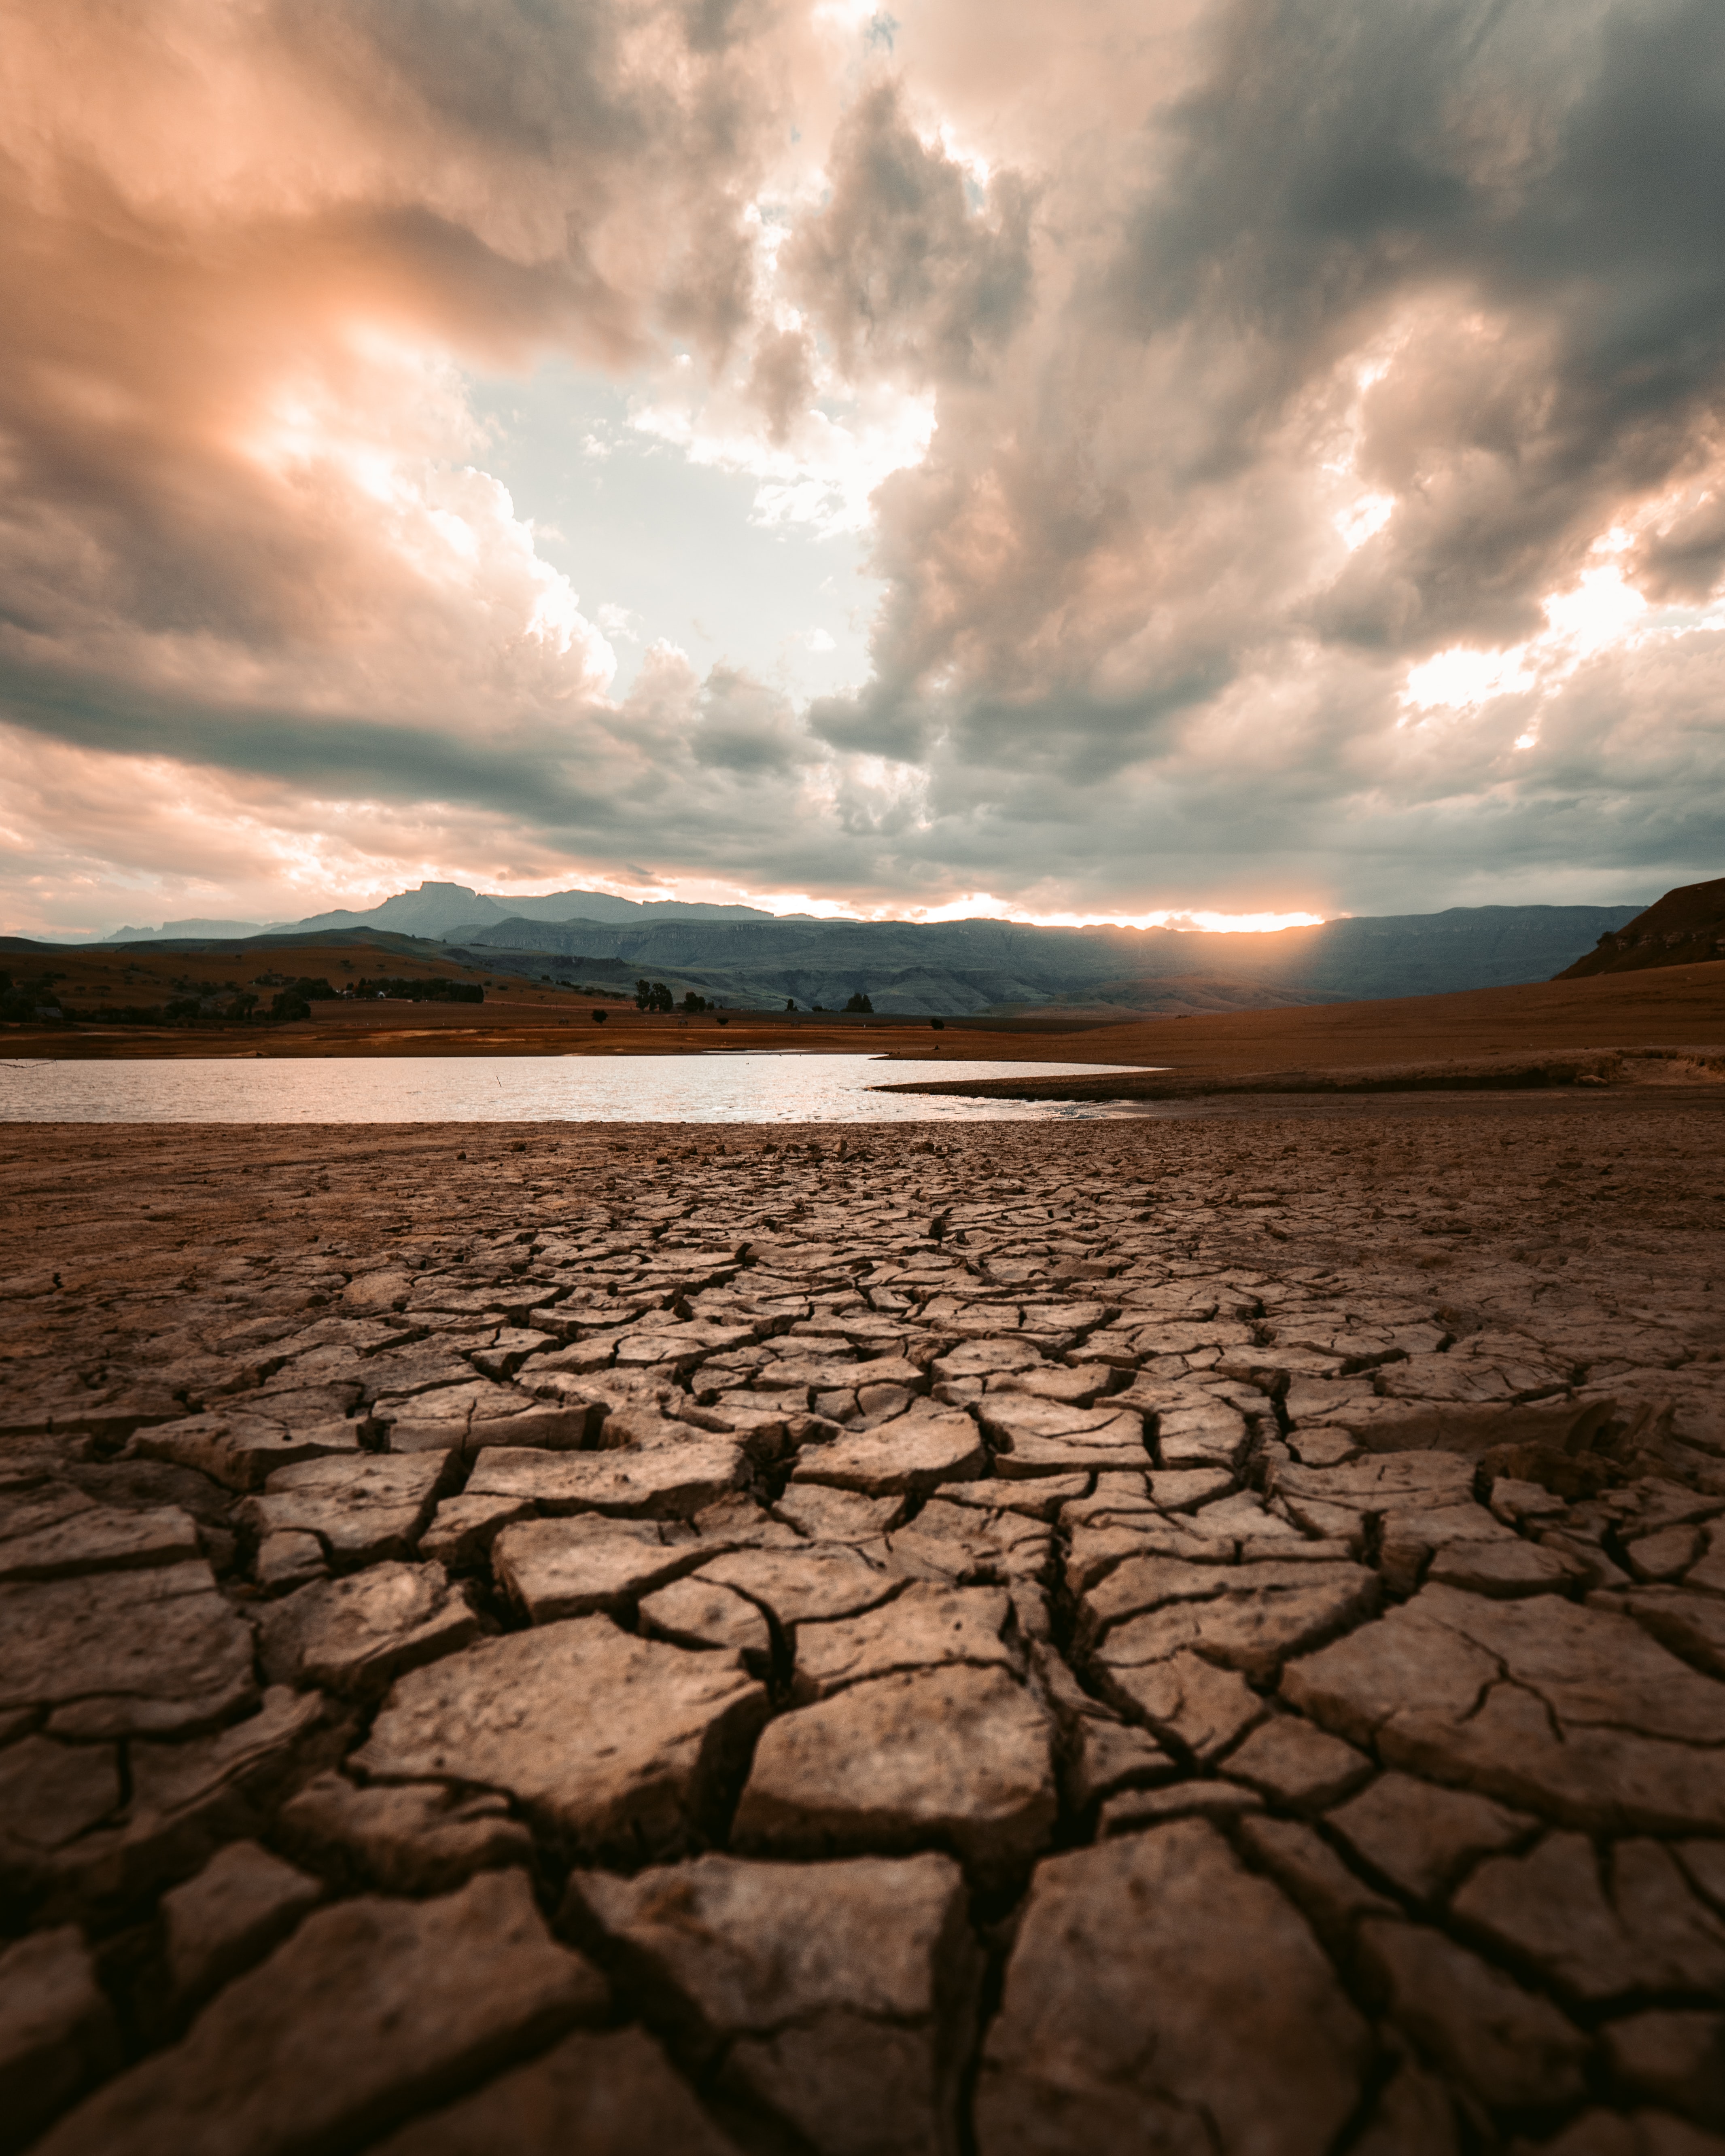
Cracked brown soil.
Courtesy of redcharlie via Unsplash
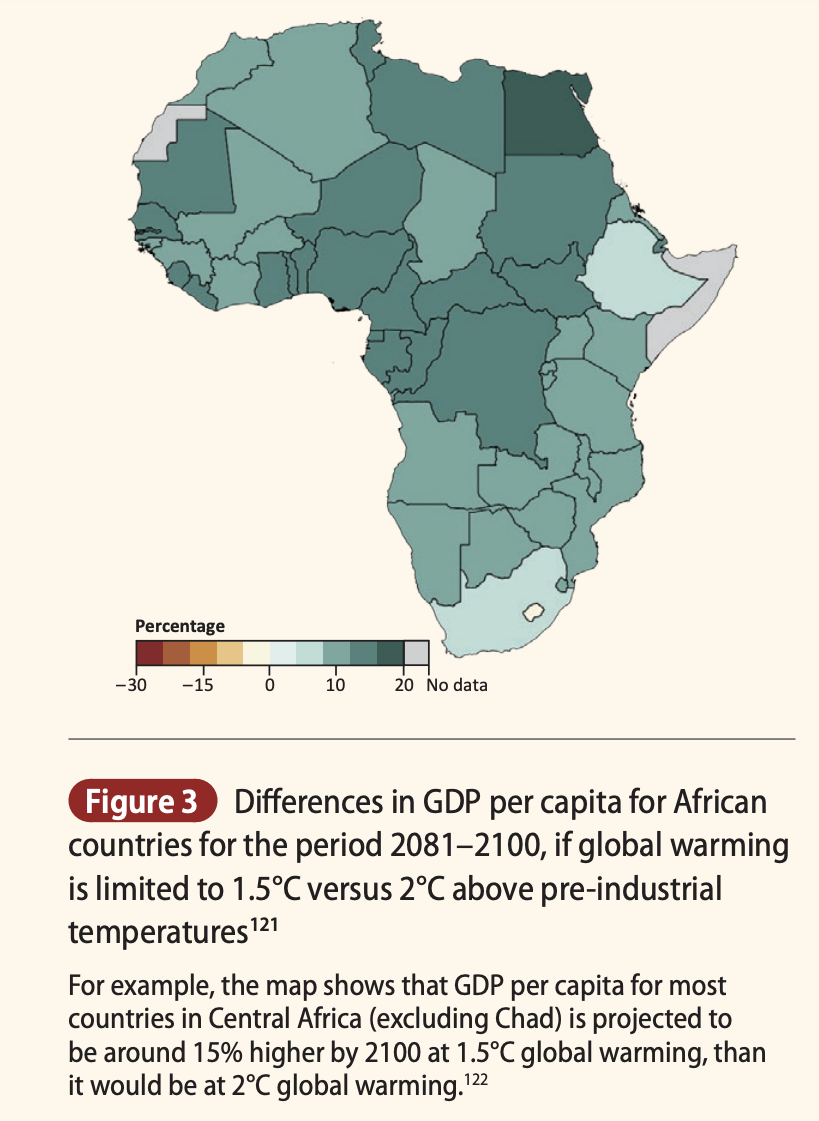
Differences in GDP capita for African countries for the period 2081-2100, if global warming is limited to 1.5°C versus 2°C above pre-industrial temperatures
Courtesy of CDKN
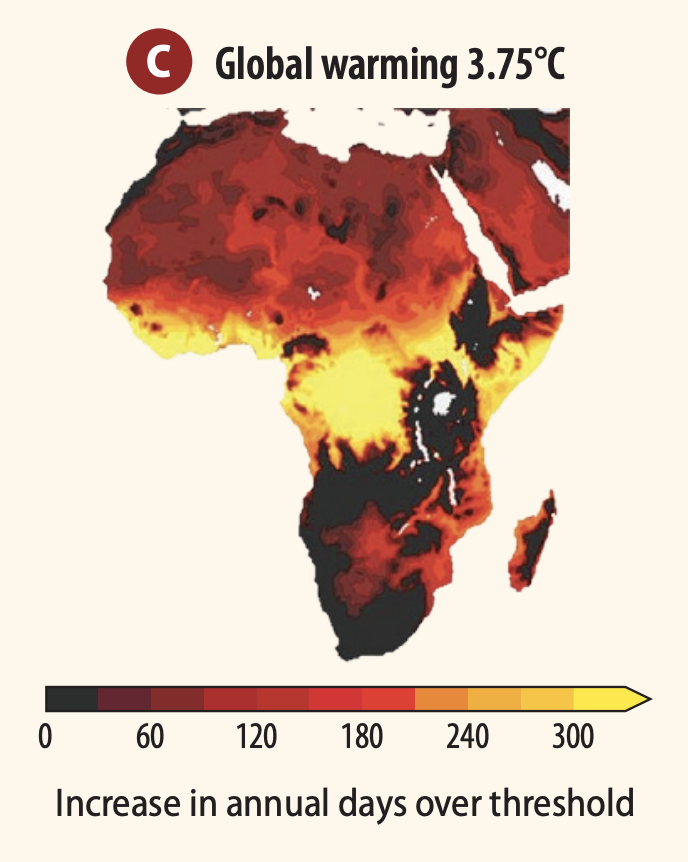
Increase in the number of days per year with severe heat stress for global warming of 3.75°C above pre-industrial levels (1850–2100).
Courtesy of CDKN
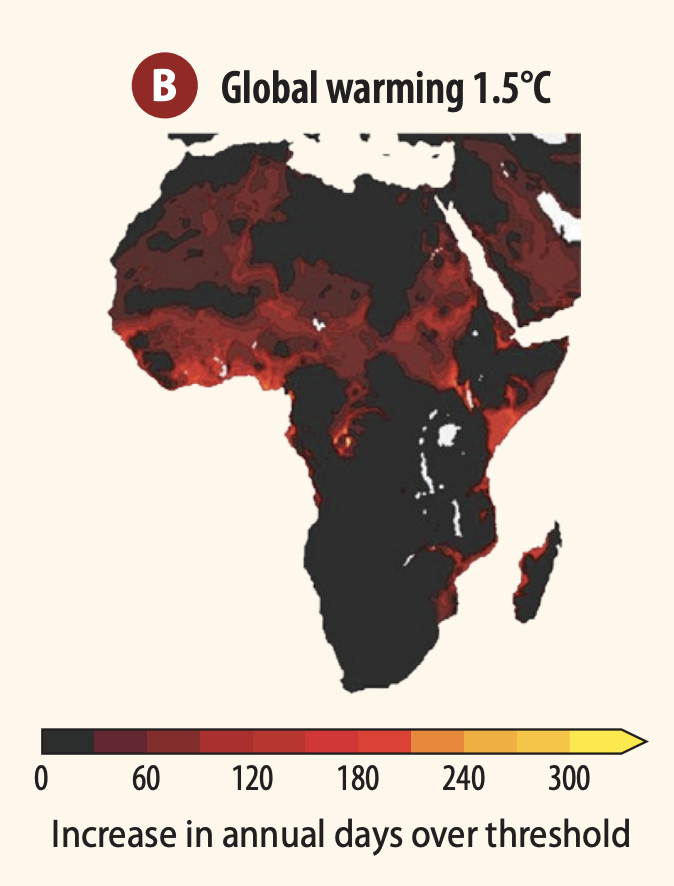
Increase in the number of days per year with severe heat stress for global warming of 1.5°C above pre-industrial levels (1850–2100)
Courtesy of CDKN